Mean, Variance, and Standard Deviation

Consider the following.
The definitions for population mean and variance used with an ungrouped frequency distribution were:
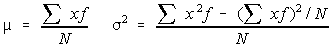
Some of you might be confused by only dividing by N. Recall that this is the population variance, the sample variance, which was the unbiased estimator for the population variance was when it was divided by n-1.
Using algebra, this is equivalent to:
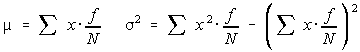
Recall that a probability is a long term relative frequency. So every f/N can be replaced by p(x). This simplifies to be:
What's even better, is that the last portion of the variance is the mean squared. So, the two formulas that we will be using are:

Here's the example we were working on earlier.
x 1 2 3 4 5 6 sum
p(x) 1/6 1/6 1/6 1/6 1/6 1/6 6/6 = 1
x p(x) 1/6 2/6 3/6 4/6 5/6 6/6 21/6 = 3.5
x^2 p(x) 1/6 4/6 9/6 16/6 25/6 36/6 91/6 = 15.1667
The mean is 7/2 or 3.5
The variance is 91/6 - (7/2)^2 = 35/12 = 2.916666...
The standard deviation is the square root of the variance = 1.7078
Do not use rounded off values in the intermediate calculations. Only round off the final answer.
You can learn how to find the mean and variance of a probability distribution using lists with the TI-82 or using the program called pdist.

Related Posts:

  • Sample Space Sample Spaces A sample space is the set of all possible outcomes. However, some sample spaces are better than others. Consider the experiment of flipping two coins. It is possible to get 0 heads, 1 head, or 2 heads. … Read More
  • Probability distributions Probability Distributions A listing of all the values the random variable can assume with their corresponding probabilities make a probability distribution. A note about random variables. A random variable does not mean … Read More
  • Mean, Variance, and Standard Deviation Mean, Variance, and Standard Deviation Consider the following. The definitions for population mean and variance used with an ungrouped frequency distribution were: Some of you might be confused by only dividin… Read More
  • Probability related term Probability Experiment Process which leads to well-defined results call outcomes Outcome The result of a single trial of a probability experiment Sample Space Set of all possible outcomes of a probability experiment Event … Read More
  • Percentiles, Deciles, Quartiles Percentiles (100 regions) The kth percentile is the number which has k% of the values below it. The data must be ranked. Rank the data Find k% (k /100) of the sample size, n. If this is an integer, add 0.5. If it isn't… Read More

0 Comments:

Powered by Blogger.

Visitors

Print Friendly Version of this pagePrint Get a PDF version of this webpagePDF


 download University Notes apps for android

Popular Posts

Flag Counter